What is pyngpong?
Pyngpong is an internal dependency monitoring system that I built to address quite a few issues faced by members from various engineering teams at my job.
It assists in many areas including: having clear visibility on open pull-requests, displaying deployment changelogs, helping a platform team keep an eye on their application’s core dependencies, helping a data science team keep track of metrics processing, helping a real-time systems team quickly evaluate the health of all processes relating to their system, and helping an infrastructure team get quick insight on overall application health which spans the business.
Feature Overview
* Note: names of employees, technologies used, and specifics on metrics have all been redacted or renamed to adhere to confidentiality regulations from the company
Pyngpong is divided into a set of widgets that serve a specific purpose, lets take a look at some of them:
Open Pull Requests
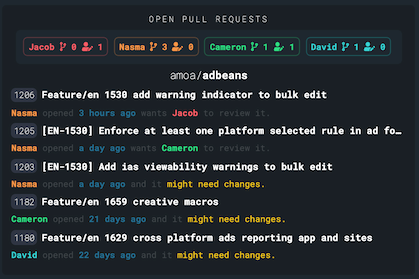
Using the Github API, pyngpong fetches and renders open pull-request information and associated metadata. This helps developers stay notified on the status of their pull request(s) and provides quick links to edit or review them. It also provides a count of open PRs and assigned PRs for each developer.
Core Dependencies
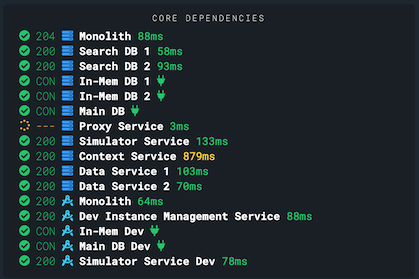
Our business critical services span a multitude of technologies, servers and processes. We have a main monolithic platform application, as well as third party APIs, in-house microservices and the list goes on. Pyngpong sends health check requests to all of these services (in some instances I have had to ask developers to create health check API endpoints just for this purpose) and elegantly displays their status as well as connection speed.
Metric Comparison
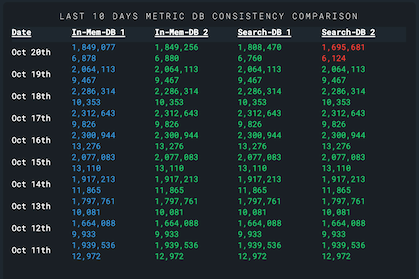
Our applications process terabytes of data every day and certain metrics are stored across multiple databases simultaneously for strong data redundancy. Pyngpong keeps track of consistency between these databases with a 10 day lookback.
Deployment Log
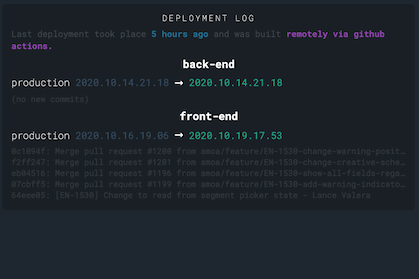
Another tool I worked on allows one of the platform teams to automate parts of their deployment process. Upon doing so, that tool generates deployment logs which are stored in a dev database. This data is generated mainly for the purpose of being consumed and displayed by pyngpong in this widget.
Bugsnag Errors
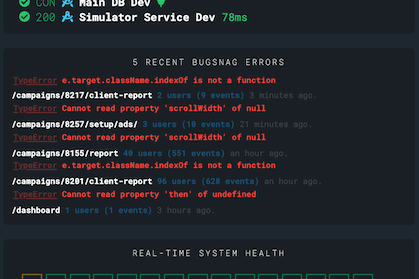
Pyngpong connects to Bugsnag using their API to pull error event information (and associated metadata) for display. Links are also generated for developers to quickly investigate and resolve these issues.
Real-Time System Health
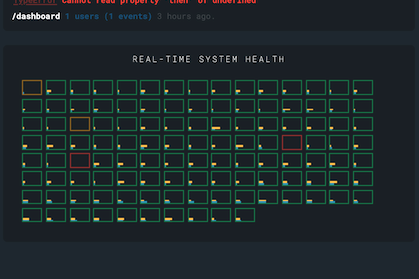
One of our real-time systems has a set of critical metrics that update every second. The status of each process is also relevant in our performance. Pyngpong consumes real-time system health data and generates a clean and animating waffle chart.
Addressing Problems In App Health Monitoring
When I started my job, I noticed that our methods of identifying production level issues were manual and relied heavily on implicit knowledge from developers who were already experienced working in our systems. This made it difficult for newer developers to jump in and help resolve incidents.
Any time one of our core dependencies went down, we would resort to a process of elimination and run commands manually to check on all of our application’s dependencies. This could become time consuming and somewhat complex as our list of dependencies spanned different technologies, servers and integrations. This process eventually became a headache for everyone, regardless of experience.
Although we were floating ideas for setting up more advanced monitoring solutions such as products from the Elastic stack, we knew we needed something soon and we needed to be able to answer a few questions quickly:
- Is anything down?
- Are any connections slow?
- What do we need to restart?
As time went on and more blindspots in our app health monitoring revealed themselves, our list of important questions grew. We now also wanted to know:
- Are our databases in sync?
- Are our processed metrics up to date and accurate?
- Is our real-time system affected?
So one evening I decided to stay late, clear my schedule, grab some tea, put on my headphones and get to work.
Designing a Centralized Monitoring System
I wanted to build something secure, easy to read, and I wanted to provide consistent data for all clients regardless of their connection speed so I made a list of requirements and came up with some implementation ideas.
the system must live on an internal server that is only accessible through (initial) manual authorization and VPN
I built my deployment pipeline for pyngpong around a secured internal server.
the system must connect to all relevant core dependencies from one source
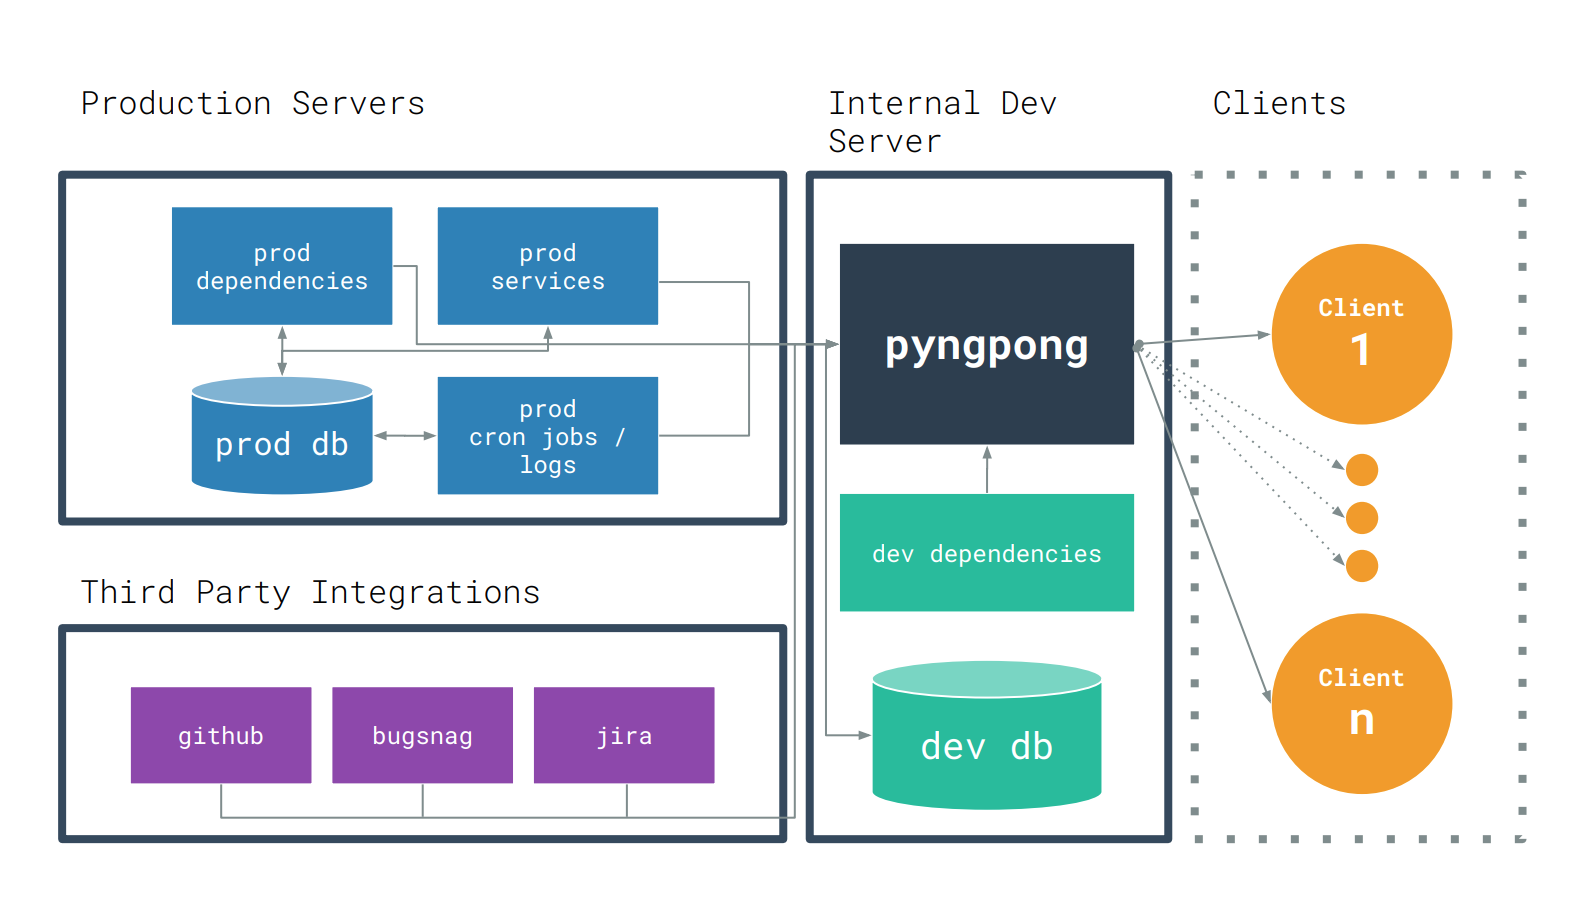
I built pyngpong as a monolith and chose JavaScript (React & Node) as my stack. I used express.js in combination with socket.io to configure my application for real-time connections. The architecture is as follows:
the system must update real-time and data must not be dependant on any one individual user’s connection
Clients connect to pyngpong’s front-end through a websocket connection and all of the health check requests, complex service queries and third party integration requests are made from a single node process on the back-end.
Outgoing HTTP requests are configured to execute continuously with staggered asyncronous polling. Relevant response data is stored in-memory and constantly broadcasted to the front-end to any connected clients.
Polling rates vary based on the complexity of the request and times are randomized within an interval to prevent overwhelming any of our processes. Pyngpong also keeps track of which specific data a connected client is interested based on what dashboard widgets they have enabled (this is done using channels with socket.io).
the system must not perform any write operations on any production server
As seen in the diagram, pyngpong is mostly consuming data in one direction through the use of health check requests and service queries. There isn’t really a need for write operations to be performed in any of our connections.
the system must use a clear “green is good, red is bad, yellow is worth investigating” design and UX paradigm
The point of pyngpong is for it to be incredibly straightforward for anyone to read and understand. If you see red text, thats bad, if you see green text, thats good. It’s not meant to be looked at for more than a few seconds to get the information you are looking for.
Conclusion
I wrote over 2000 lines of code and people enjoy using pyngpong. Aside from just my own team, some developers in other engineering teams have also integrated it into their day-to-day workflow. What started off as a tool to help resolve issues when servers went down has now become an integral part in evaluating the health of our business critical systems. I learned a lot and have helped saved my colleagues loads of time.